Offers a complete line of products and services for the printing industry, including paper, graphic and office consumables, and logistics’ services.
Offers a complete line of products and services for the printing industry, including paper, graphic and office consumables, and logistics’ services.
Tailor-made solutions, packaging customization and a global range of packaging products: boxes, films, straps, tapes, fillings, bags, labels and equipment.
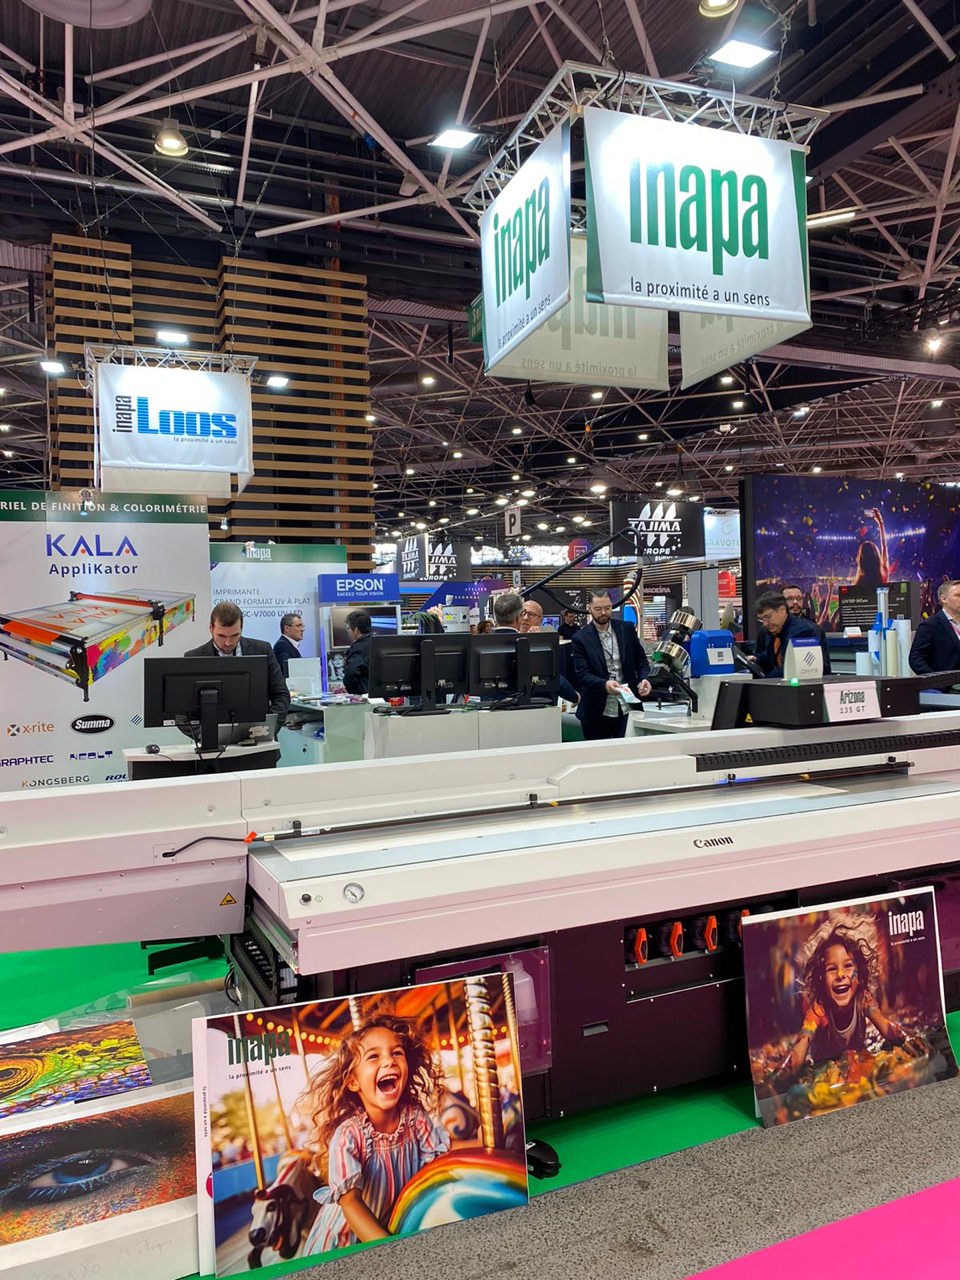
Distribution of a full range of products and services for large format digital printing: printers, inks/toners, media, software and technical assistance.
2022

Do you want to join a multinational company in continuous growth?
Check out our offers!


The Inapa Group conducts its operations in 10 countries: Germany, France, Spain, Portugal, Austria, the Netherlands, Belgium, Luxembourg, Turkey and Angola.
See Map